It has been quite a while since we run our benchmarks against other networks. Actually the last time we had the benchmarks in our documentation was for Phalcon 1.3! Yes we know, we have been neglecting this.
Hopefully this post will offer some perspective on what you can expect from Phalcon and your application. It goes without saying that every application needs the best design for its needs, but using Phalcon can also push your application’s performance even further.
Methodology
We have installed the stock application for each framework. We have ensured that there is one route, one controller and one view that will allow us to display Hello World on the screen. Naturally, this is not a real life example, but it demonstrates the minimum resources needed to display a simple string on the screen.
Note: These are the stock applications that each framework offers. The only thing that we changed is to put each framework in Production mode.
This benchmark only measures the time it takes for each framework to start, run each action, present the result needed and free up the resources at the end of the request. Any PHP application based on the said framework will need this time and resources. It is safe to assume that any implementations that will be much more complex than this one will require additional resources per request.
The ab benchmarking tool from Apache was used for these tests. 1,000 requests using 5 concurrent connections for each framework.
Results
We will start with the results of our benchmark. The hardware used, raw data as well as setup/configuration changes we did for each framework are further down in this post.
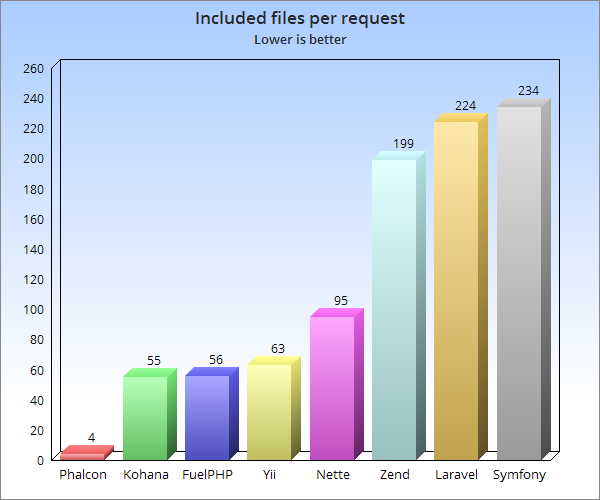
Included Files
We have used the get_included_files() function to figure out how many files have been included for one request. The call to the function was at the end of the entry point, usually index.php (lower is better).
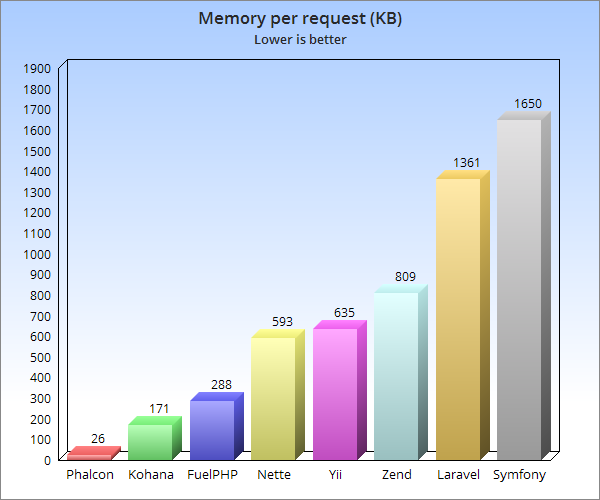
Memory used (KB)
We have used the memory_get_usage() function to figure out how many much memory was used for each request. The call to this function was at the end of the entry point, usually index.php. (lower is better).
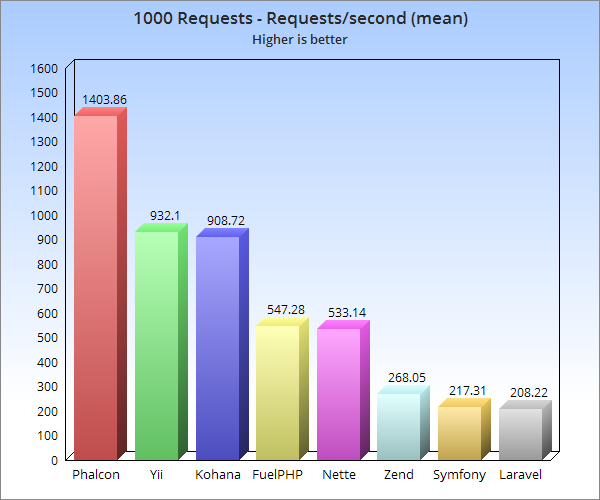
Requests per Second (mean)
Using the ab tool, we measured the requests per second that each framework could handle. (higher is better).
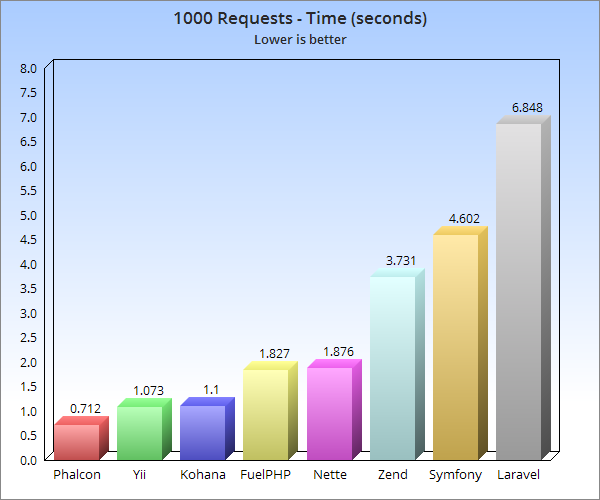
Time to complete 1,000 requests
Again using the ab tool, we measured the time it took to complete 1,000 requests. (lower is better).
Conclusion
Phalcon is clearly outperforming any other framework in this test.
Again we will stress out that these are just the stock applications that come with each framework. The results will definitely vary based on your installation. For instance a developer could remove services from a particular framework which will speed it up (at least the included files) but could also add more services which would slow it down.
Nothing beats a good design or better yet, the best design for the application needs. However, if you can gain some performance and lower your memory consumption by just using Phalcon, it is worth a look and a try if you haven’t done so already .
If any of our readers have suggestions that we could implement to make this benchmark as realistic as possible, feel free to issue a pull request with your suggestions.
The last benchmark that one can find is from TechEmpower which was conducted on November 16, 2016. According to their test schedule, we should have seen round 14 in February this year but that has not happened yet.
<3 Phalcon Team
Appendix
Github Repo
Hardware
I set up a virtual machine with Ubuntu Server 16.10. We stopped the X server and allocated 4GB of RAM and 50GB of hard drive space.
After the system was updated to the latest packages, Apache was installed on the virtual machine. For PHP and Phalcon we chose to use PHP 7.1 using the PPA from Ondřej Surý.
PHP
Version
PHP 7.1.3-3+deb.sury.org~yakkety+1 (cli) (built: Mar 25 2017 14:01:32) ( NTS )
Copyright (c) 1997-2017 The PHP Group
Zend Engine v3.1.0, Copyright (c) 1998-2017 Zend Technologies
    with Zend OPcache v7.1.3-3+deb.sury.org~yakkety+1, Copyright (c) 1999-2017, by Zend Technologies
Modules
OPCache was enabled and the installation was the default one without any modifications in php.ini. The modules installed were:
calendar, Core, ctype, curl, date, dom, exif, fileinfo, filter, ftp, gettext, hash, iconv, intl, json, libxml, mbstring, mcrypt, openssl, pcntl, pcre, PDO, phalcon, Phar, posix, readline, Reflection, session, shmop, SimpleXML, sockets , SPL, standard, sysvmsg, sysvsem, sysvshm, tokenizer, wddx, xml, xmlreader, xmlwriter, xsl, Zend OPcache, zlib
Frameworks
The frameworks compared were:
- FuelPHP (v1.8.0)
- Kohana (v3.3.6)
- Laravel (v5.4)
- Nette (v2.4)
- Phalcon (v3.1.2)
- Symfony (v3.2)
- Yii (v2.0.11)
- Zend Framework (v.3.0.1)
Installation and Changes
We tried to make this test as realistic as possible, ensuring that all frameworks behave in production mode. However, nobody is perfect so any suggestions that the community can provide to tweak each framework to its maximum potential, feel free to issue a pull request in our Github repository.
FuelPHP
curl https://get.fuelphp.com/oil | sh
oil create fuelphp
fuelphp/fuel/app/bootstrap.php
\Fuel::$env = \Arr::get($_SERVER, 'FUEL_ENV', \Arr::get($_ENV, 'FUEL_ENV', \Fuel::PRODUCTION));
// \Fuel::$env = \Arr::get($_SERVER, 'FUEL_ENV', \Arr::get($_ENV, 'FUEL_ENV', \Fuel::DEVELOPMENT));
fuelphp/fuel/app/views/welcome/index.php
Hello World!
Kohana
wget https://github.com/kohana/kohana/releases/download/v3.3.6/kohana-v3.3.6.zip
unzip kohana-v3.3.6.zip
kohana/application/bootstrap.php
if (isset($_SERVER['KOHANA_ENV']))
{
    Kohana::$environment = constant('Kohana::'.strtoupper($_SERVER['KOHANA_ENV']));
}
Kohana::$environment = Kohana::PRODUCTION;
kohana/application/classes/Controller/Welcome.php
<?php defined('SYSPATH') or die('No direct script access.');

class Controller_Welcome extends Controller_Template {
        public $template = 'welcome';
        public function action_index()
        {
                $this->template->message = 'Hello, World!';
        }

} // End Welcome
kohana/application/views/welcome.php
<?php echo $message; ?>
Laravel
composer create-project --prefer-dist laravel/laravel laravel
laravel/.env
APP_DEBUG=false
laravel/config/app.php
    ...
    'env' => env('APP_ENV', 'production'),
    'debug' => env('APP_DEBUG', false),
    ...
laravel/resources/views/welcome.blade.php
Hello World!
Nette
composer create-project nette/web-project nette
cd nette
chmod -R a+rw temp log
nette/app/presenters/templates/Homepage/default.latte
Hello World!
Phalcon
Downloaded sample from the MVC repository.
phalcon/app/views/index.phtml
Hello World!
Symfony
composer create-project symfony/framework-standard-edition symfony
symfony/app/Resources/views/base.html.twig
Hello World
Yii
composer global require "fxp/composer-asset-plugin:^1.2.0"
composer create-project --prefer-dist yiisoft/yii2-app-basic yii
yii/web/index.php
<?php

// comment out the following two lines when deployed to production
//defined('YII_DEBUG') or define('YII_DEBUG', true);
//defined('YII_ENV') or define('YII_ENV', 'dev');
yii/config/web.php
/**
if (YII_ENV_DEV) {
    // configuration adjustments for 'dev' environment
    $config['bootstrap'][] = 'debug';
    $config['modules']['debug'] = [
        'class' => 'yii\debug\Module',
        // uncomment the following to add your IP if you are not connecting from localhost.
        //'allowedIPs' => ['127.0.0.1', '::1'],
    ];

    $config['bootstrap'][] = 'gii';
    $config['modules']['gii'] = [
        'class' => 'yii\gii\Module',
        // uncomment the following to add your IP if you are not connecting from localhost.
        //'allowedIPs' => ['127.0.0.1', '::1'],
    ];
}
*/
return $config;
yii/views/site/index.php
Hello World!
yii/views/layouts/main.php
<?= $content ?>
Zend Framework
composer create-project zendframework/skeleton-application zf
zf/public/index.php
// Retrieve configuration
$appConfig = require __DIR__ . '/../config/application.config.php';
//if (file_exists(__DIR__ . '/../config/development.config.php')) {
//    $appConfig = ArrayUtils::merge($appConfig, require __DIR__ . '/../config/development.config.php');
//}
zf/module/Application/view/layout/layout.phtml
<?= $this->content ?>
ab results
FuelPHP
This is ApacheBench, Version 2.3 <$Revision: 1706008 $>
Copyright 1996 Adam Twiss, Zeus Technology Ltd, https://www.zeustech.net/
Licensed to The Apache Software Foundation, https://www.apache.org/

Benchmarking 10.4.6.123 (be patient)


Server Software:        Apache/2.4.18
Server Hostname:        10.4.6.123
Server Port:            80

Document Path:          /fuelphp/public/
Document Length:        13 bytes

Concurrency Level:      5
Time taken for tests:   1.827 seconds
Complete requests:      1000
Failed requests:        0
Total transferred:      180000 bytes
HTML transferred:       13000 bytes
Requests per second:    547.28 [#/sec] (mean)
Time per request:       9.136 [ms] (mean)
Time per request:       1.827 [ms] (mean, across all concurrent requests)
Transfer rate:          96.20 [Kbytes/sec] received

Connection Times (ms)
              min  mean[+/-sd] median   max
Connect:        0    1   0.6      0       4
Processing:     1    9  10.0      4      72
Waiting:        1    7   8.6      3      61
Total:          2    9  10.0      4      75
WARNING: The median and mean for the initial connection time are not within a normal deviation
        These results are probably not that reliable.

Percentage of the requests served within a certain time (ms)
  50%      4
  66%      8
  75%     12
  80%     15
  90%     23
  95%     31
  98%     40
  99%     45
 100%     75 (longest request)
Kohana
This is ApacheBench, Version 2.3 <$Revision: 1706008 $>
Copyright 1996 Adam Twiss, Zeus Technology Ltd, https://www.zeustech.net/
Licensed to The Apache Software Foundation, https://www.apache.org/

Benchmarking 10.4.6.123 (be patient)


Server Software:        Apache/2.4.18
Server Hostname:        10.4.6.123
Server Port:            80

Document Path:          /kohana/
Document Length:        13 bytes

Concurrency Level:      5
Time taken for tests:   1.100 seconds
Complete requests:      1000
Failed requests:        0
Total transferred:      180000 bytes
HTML transferred:       13000 bytes
Requests per second:    908.72 [#/sec] (mean)
Time per request:       5.502 [ms] (mean)
Time per request:       1.100 [ms] (mean, across all concurrent requests)
Transfer rate:          159.74 [Kbytes/sec] received

Connection Times (ms)
              min  mean[+/-sd] median   max
Connect:        0    0   0.5      0       4
Processing:     1    5   5.1      3      45
Waiting:        1    4   4.6      3      45
Total:          1    5   5.0      4      46

Percentage of the requests served within a certain time (ms)
  50%      4
  66%      4
  75%      5
  80%      6
  90%     12
  95%     16
  98%     22
  99%     27
 100%     46 (longest request)
Laravel
This is ApacheBench, Version 2.3 <$Revision: 1706008 $>
Copyright 1996 Adam Twiss, Zeus Technology Ltd, https://www.zeustech.net/
Licensed to The Apache Software Foundation, https://www.apache.org/

Benchmarking 10.4.6.123 (be patient)


Server Software:        Apache/2.4.18
Server Hostname:        10.4.6.123
Server Port:            80

Document Path:          /laravel/public/
Document Length:        13 bytes

Concurrency Level:      5
Time taken for tests:   4.803 seconds
Complete requests:      1000
Failed requests:        0
Total transferred:      997232 bytes
HTML transferred:       13000 bytes
Requests per second:    208.22 [#/sec] (mean)
Time per request:       24.013 [ms] (mean)
Time per request:       4.803 [ms] (mean, across all concurrent requests)
Transfer rate:          202.77 [Kbytes/sec] received

Connection Times (ms)
              min  mean[+/-sd] median   max
Connect:        0    0   0.4      0       6
Processing:     4   24  21.0     21     280
Waiting:        4   20  20.2     16     280
Total:          4   24  21.0     21     281

Percentage of the requests served within a certain time (ms)
  50%     21
  66%     29
  75%     33
  80%     36
  90%     43
  95%     54
  98%     71
  99%     99
 100%    281 (longest request)
Nette
This is ApacheBench, Version 2.3 <$Revision: 1706008 $>
Copyright 1996 Adam Twiss, Zeus Technology Ltd, https://www.zeustech.net/
Licensed to The Apache Software Foundation, https://www.apache.org/

Benchmarking 10.4.6.123 (be patient)


Server Software:        Apache/2.4.18
Server Hostname:        10.4.6.123
Server Port:            80

Document Path:          /nette/www/
Document Length:        13 bytes

Concurrency Level:      5
Time taken for tests:   1.876 seconds
Complete requests:      1000
Failed requests:        0
Total transferred:      264000 bytes
HTML transferred:       13000 bytes
Requests per second:    533.14 [#/sec] (mean)
Time per request:       9.378 [ms] (mean)
Time per request:       1.876 [ms] (mean, across all concurrent requests)
Transfer rate:          137.45 [Kbytes/sec] received

Connection Times (ms)
              min  mean[+/-sd] median   max
Connect:        0    1   0.6      0       4
Processing:     1    9   9.0      5      73
Waiting:        1    7   7.7      4      49
Total:          1    9   9.0      5      73
WARNING: The median and mean for the initial connection time are not within a normal deviation
        These results are probably not that reliable.

Percentage of the requests served within a certain time (ms)
  50%      5
  66%      9
  75%     13
  80%     16
  90%     22
  95%     28
  98%     35
  99%     43
 100%     73 (longest request)
Phalcon
This is ApacheBench, Version 2.3 <$Revision: 1706008 $>
Copyright 1996 Adam Twiss, Zeus Technology Ltd, https://www.zeustech.net/
Licensed to The Apache Software Foundation, https://www.apache.org/

Benchmarking 10.4.6.123 (be patient)


Server Software:        Apache/2.4.18
Server Hostname:        10.4.6.123
Server Port:            80

Document Path:          /phalcon/
Document Length:        13 bytes

Concurrency Level:      5
Time taken for tests:   0.712 seconds
Complete requests:      1000
Failed requests:        0
Total transferred:      180000 bytes
HTML transferred:       13000 bytes
Requests per second:    1403.86 [#/sec] (mean)
Time per request:       3.562 [ms] (mean)
Time per request:       0.712 [ms] (mean, across all concurrent requests)
Transfer rate:          246.77 [Kbytes/sec] received

Connection Times (ms)
              min  mean[+/-sd] median   max
Connect:        0    0   0.3      0       4
Processing:     1    3   3.9      2      33
Waiting:        0    2   1.7      2      28
Total:          1    4   4.0      3      33

Percentage of the requests served within a certain time (ms)
  50%      3
  66%      3
  75%      3
  80%      3
  90%      6
  95%     11
  98%     19
  99%     24
 100%     33 (longest request)
Symfony
This is ApacheBench, Version 2.3 <$Revision: 1706008 $>
Copyright 1996 Adam Twiss, Zeus Technology Ltd, https://www.zeustech.net/
Licensed to The Apache Software Foundation, https://www.apache.org/

Benchmarking 10.4.6.123 (be patient)


Server Software:        Apache/2.4.18
Server Hostname:        10.4.6.123
Server Port:            80

Document Path:          /full/symfony/web/
Document Length:        13 bytes

Concurrency Level:      5
Time taken for tests:   4.602 seconds
Complete requests:      1000
Failed requests:        0
Total transferred:      252000 bytes
HTML transferred:       13000 bytes
Requests per second:    217.31 [#/sec] (mean)
Time per request:       23.008 [ms] (mean)
Time per request:       4.602 [ms] (mean, across all concurrent requests)
Transfer rate:          53.48 [Kbytes/sec] received

Connection Times (ms)
              min  mean[+/-sd] median   max
Connect:        0    0   0.4      0       4
Processing:     4   23  21.3     21     277
Waiting:        3   15  20.2      9     276
Total:          4   23  21.3     22     277

Percentage of the requests served within a certain time (ms)
  50%     22
  66%     27
  75%     30
  80%     32
  90%     38
  95%     46
  98%     55
  99%     72
 100%    277 (longest request)
Yii
This is ApacheBench, Version 2.3 <$Revision: 1706008 $>
Copyright 1996 Adam Twiss, Zeus Technology Ltd, https://www.zeustech.net/
Licensed to The Apache Software Foundation, https://www.apache.org/

Benchmarking 10.4.6.123 (be patient)


Server Software:        Apache/2.4.18
Server Hostname:        10.4.6.123
Server Port:            80

Document Path:          /yii/web/
Document Length:        12 bytes

Concurrency Level:      5
Time taken for tests:   1.073 seconds
Complete requests:      1000
Failed requests:        0
Total transferred:      179000 bytes
HTML transferred:       12000 bytes
Requests per second:    932.10 [#/sec] (mean)
Time per request:       5.364 [ms] (mean)
Time per request:       1.073 [ms] (mean, across all concurrent requests)
Transfer rate:          162.94 [Kbytes/sec] received

Connection Times (ms)
              min  mean[+/-sd] median   max
Connect:        0    0   0.4      0       4
Processing:     1    5   7.5      2      54
Waiting:        1    4   6.3      2      42
Total:          1    5   7.5      2      54

Percentage of the requests served within a certain time (ms)
  50%      2
  66%      3
  75%      4
  80%      6
  90%     15
  95%     23
  98%     32
  99%     38
 100%     54 (longest request)
Zend Framework
This is ApacheBench, Version 2.3 <$Revision: 1706008 $>
Copyright 1996 Adam Twiss, Zeus Technology Ltd, https://www.zeustech.net/
Licensed to The Apache Software Foundation, https://www.apache.org/

Benchmarking 10.4.6.123 (be patient)


Server Software:        Apache/2.4.18
Server Hostname:        10.4.6.123
Server Port:            80

Document Path:          /zf/public/
Document Length:        24 bytes

Concurrency Level:      5
Time taken for tests:   3.731 seconds
Complete requests:      1000
Failed requests:        0
Total transferred:      191000 bytes
HTML transferred:       24000 bytes
Requests per second:    268.05 [#/sec] (mean)
Time per request:       18.654 [ms] (mean)
Time per request:       3.731 [ms] (mean, across all concurrent requests)
Transfer rate:          50.00 [Kbytes/sec] received

Connection Times (ms)
              min  mean[+/-sd] median   max
Connect:        0    0   0.6      0       4
Processing:     3   18  18.4      8     101
Waiting:        3   13  15.0      5     101
Total:          3   19  18.4      8     101

Percentage of the requests served within a certain time (ms)
  50%      8
  66%     23
  75%     31
  80%     35
  90%     46
  95%     55
  98%     67
  99%     76
 100%    101 (longest request)
Revisions
2017-04-13 18:22
Symfony: changed $kernel = new AppKernel('prod', false); and rerun the results. Kudos (@msvrtan).
Chat - Q&A
Support
Social Media
Videos
<3 Phalcon Team